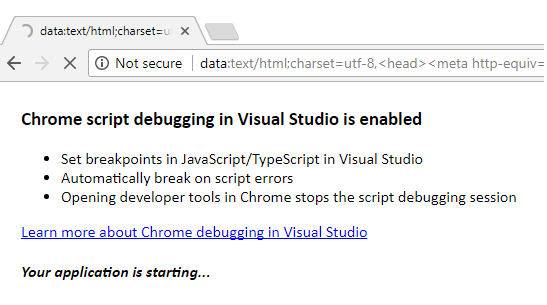
How can I disable this debugging(image below), I'm using Visual Studio 2017 Community edition and don't like the new chrome window whenever I click Debug in Visual Studio using Chrome browser

Does anyone know how to disable it?
 Answered by:- Sam
This is the new feature of Visual Studio 2017, earlier we would have to use IE in debug mode to debug javascript, but now it is enabled in Visual Studio 2017 RC and later editions.
What happens is that Visual Studio is attaching to Chrome using the remote debugging protocol and then redirects to the ASP.NET project URL (something like http://localhost:12345) after it attaches. After the attach is complete, the “Please wait while we attach…” message remains visible while the ASP.NET site starts up where normally you’d see a blank browser during this time.
Once the debugger is attached, script debugging is now enabled for all JavaScript files in the project as well as all TypeScript files if there is source map information available.
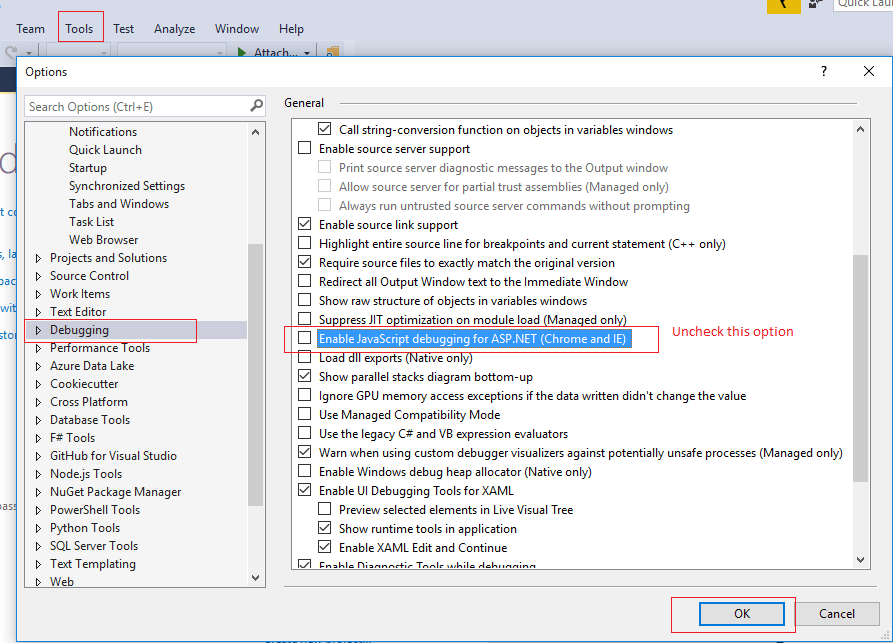
You can disable this option by navigation to "Tools"-> "Options"-> Select "Debugging" (Left Pane) & "Enable Javascript debugging for ASP.NET (Chrome & IE) (uncheck this option)"

If you have updated VS 2017 for 15.7 or above:
Tools -> Options -> Projects and Solutions > Web Projects, uncheck "Stop debugger when browser window is closed"
Thanks
 Answered by:- vikas_jk
Above answer is correct, But I would like to add few more details to it, first of all if you need to debug JavaScript again, just check the above mentioned settings again and you should be back to running the built-in browser and debugging again.
UPDATE (since version 15.17.1): To keep Visual Studio from opening a new window when debuging. Go into Tools -> Options then navigate into Projects and Solutions -> Web Projects and uncheck the option Stop debugger when browser window is closed.

That's it, we are done
Subscribe to our weekly Newsletter & Keep getting latest article/questions in your inbox weekly