
If you have just started learning C# or you are new to Visual Studio IDE and want to learn more about it, one of the best features of visual studio is debugging code, which allows developer to check the output of any variable or output of each line statement while code is executing.
What is debugging?
Debugging is simply the process to identifying a problem, and then either correcting the problem or determining a way to work around it.
In Visual studio debugging, you can see how variables value changes while the program executes, and it is possible to see these changes. This is useful for when you want to make sure the values are correct and if they aren't correct, you can determine a way to work around of the problem.
How to debug in Visual Studio?
To start understanding Visual Studio IDE debugging, we would have to create a sample C# console application program, I am using this simple C# program in Visual Studio, which uses variables and we will test how we can see variables output while debugging.
Sample C# Program
class Program
{
static void Main(string[] args)
{
// An integer
int intValue = 1;
// A string
string stringValue = "Hello";
// An array of true/false
bool[] b = new bool[]
{
true,
false,
false
};
Console.WriteLine();
}
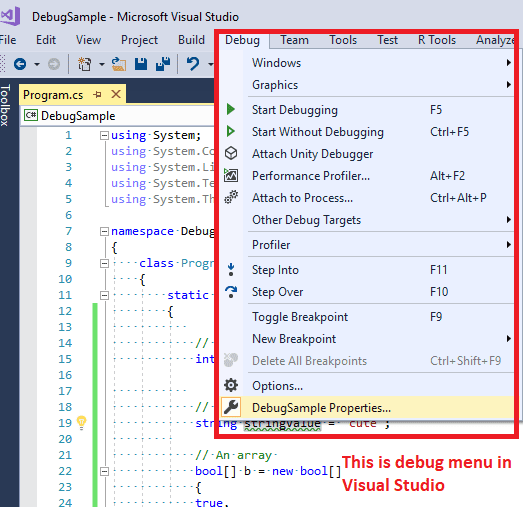
}now, as you can see above, we will be using above program in Visual Studio to debug it, and also we can see debug menu available in Visual Studio.
Add the breakpoint in Visual Studio (C# program)
Now, we should add a breakpoint in our C# program.
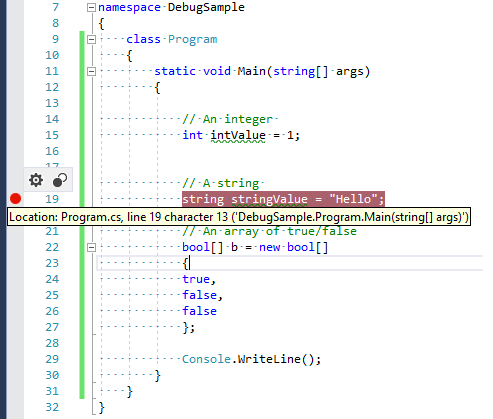
On the far left of your source code tab, you will see a narrow gray strip, Click on it in the line you want to debug. The red circle will appear once you click it, it is where you have set the debugging breakpoint.
In the above code sample and image, we are debugging line "string stringValue = "Hello";", so when the red block is hit, it will open debugger and we can then debug code.
To start the debugger, select F5, or choose the Debug Target button in the Standard toolbar, or choose the Start Debugging button in the Debug toolbar, or choose Debug -> Start Debugging from the menu bar, here is the sample gif image

As you can see in the above gif image when the breakpoint is hit debugger opens and then you can hover over any variable and check it's it value.
You can also see variables value, but navigating to "Debug -> Windows -> Locals", you should see output as below

While debugging, you can step through the code in a number of different methods, you can step through line by line using F11, step over using F10 or step out using (Shift+F11).
-
Step-Through: Each and every line of code executed will be debugged. When a method call is invoked the flow enters the method and returns to the calling line after it has completed.
-
Step Over: As above, however, you will not debug internal method calls. This is a better debug tool if you already know that a method is working and just wasn’t to call it without debugging.
- Step Out: If you entered a method using Step-Through, Step Out will return you to the point that method was called.
Disabling Debugger
Before you deploy your website on server or windows application, you should disable debugger.
- In the ASP.NET website, you can directly change the compilation tag's debug attribute to false in web.config.
- In Windows applications, go to Project -> MyApplication Properties. Then change the Configure dropdown to Release.
Debugging tips in Visual Studio
1. Edit the value and continue
With Visual Studio 2012 or later, while debugging if you found any error in your code and want to change its value without stopping debugger or without rebuilding whole project, you can edit the value, save the changes and then continue debugging.
Edit-and-continue changes should be local, i.e., within one method. If you change the method signature, add new methods or classes, you'll have to restart the app, or undo the changes to continue.
Note: You should have this feature enabled in your Visual Studio, to do this, you can navigate to "
Tools -> Options -> Debugging -> General > Check for 'Enable Edit and Continue'"
2. Set next statement by dragging and dropping yellow marker
You can just drag the yellow statement marker to the line you want to be executed next, like the function that has just failed, and then simply step in.
You can drag it above break-point also, just drag and drop the yellow marker to the line you want to execute next.
You can see the example of this in point number 4, when we are dragging cursor back to first line of code in Console program.
3. Hover over mouse to variable to evaluate it's value
Things get easier with the debugger, you can simply point your mouse at a variable of interest. Moreover, classes and structures will be expanded with one click, allowing you to find the field you need quickly and conveniently.
4. Helpful Watch window
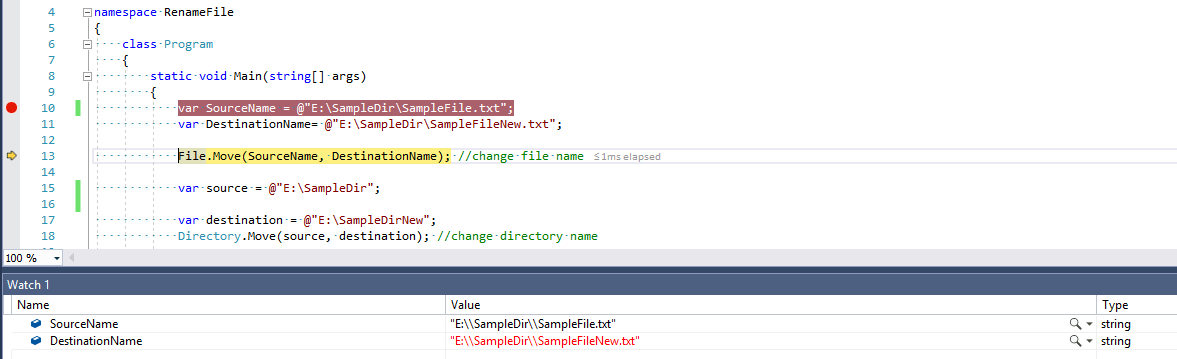
Every modern debugger has a watch window. However, in Visual Studio you can easily add and remove variables there.
You can open up watch windows from Debug -> Windows -> Watch (Ctrl+Alt+W,1).
Just click on the empty line, type your expression, and press Enter. Or simply press the delete button to remove an expression that is no longer needed.
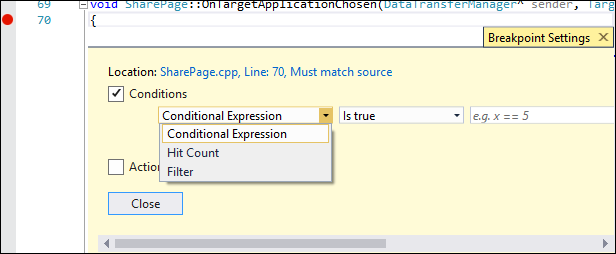
5. Conditional breakpoints
You can create conditional breakpoints also, for this, set a breakpoint as usual. Right click it. Click Condition.
You may also like to read:
Various star pattern program in c#
How to read and write in Console app using C#?
Validating Email in ASP.NET using Regularexpressionvalidator
 Buy us a coffee
 Become a Patron