
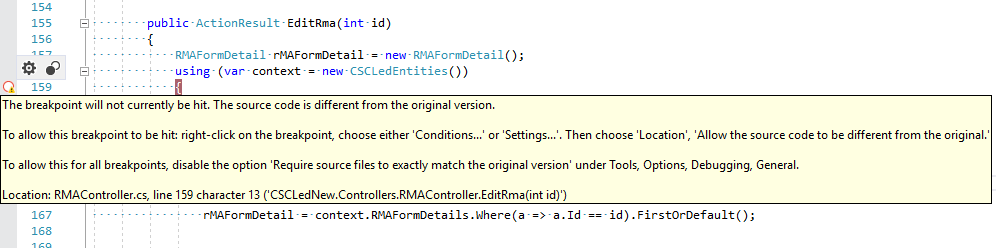
If you are C# developer or ASP.NET web -developer, who is using Visual Studio as his/her IDE, at one stage you will hit with an error called "The breakpoint will not currently be hit.The source code is different from original version.", so in this post, I have explained how we can resolve this using few simple steps.
This problem usually occurs because the web application is not able to pick up the .PDB from the Temporary ASP.NET Folder.
Resolving breakpoint will not be hit error ways
- We will start with a simple solution, try to clean your Visual Studio solution, and then rebuild. For this, simply open your "Solution Explorer", select your "Solution" and right-click on it, Select "Clean Solution", once the solution is cleaned, which will delete all the compiled and temporary files associated with a solution, select "Build" solution and then check if the issue exists.
OR
First Close Visual Studio, Open Project again in Visual Studio -> Clean Solution, and then Rebuild Solution. - Make sure, you have set the configuration to "Debug" mode and you are not working on "Release" mode while debugging your application.
- If the above 2 methods don't work for you, you can try the third method, which is to make sure your .NET solution is configured properly, follow these steps
- Right-click on your project name
- Select Properties
- Select the "Build" tab
- Make sure "Define DEBUG constant" and "Define TRACE constant" are checked
- Make sure "Optimize Code" is unchecked
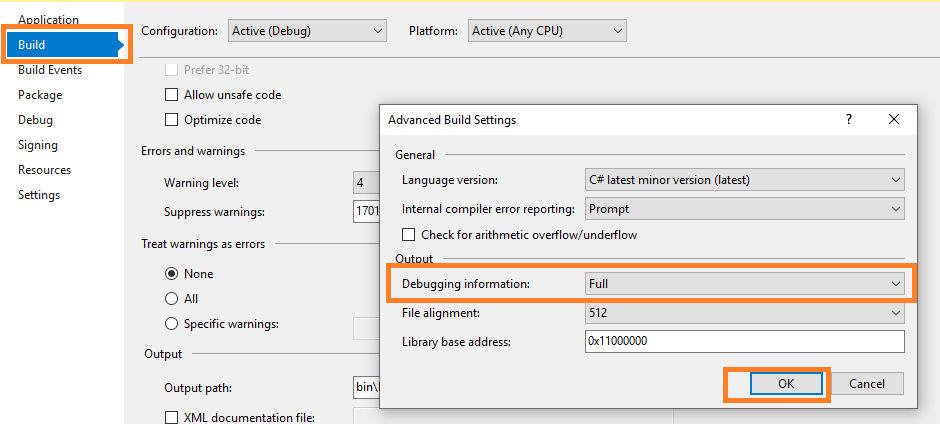
- Click the "Advanced" button at the bottom of the Build tab page
- Make sure that "Debug Info:" is set to "full"
- Click "Ok" and re-build your project.
- If all of the above steps, doesn't work for you, you can try to disable the "Just My Code" option in the Debug/General settings.
For this navigate to "debug" -> select "options" and then from right-pane, de-select "Enable just my code"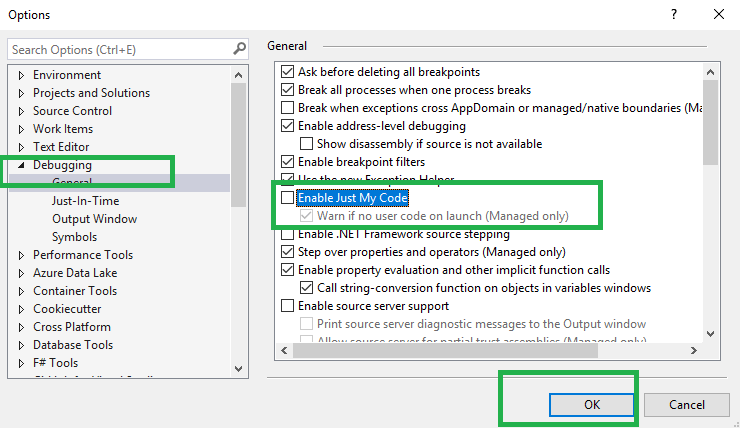
- Solution 5 may work when you are debugging a .NET web project that is a .NET remoting endpoint running on the Visual Studio development server and showing "no symbols loaded".
- Right click on solution -> Properties
- Look under Common Properties -> Startup Project
- Select multiple startup projects
- select Start action on the projects you need to debug.
- You might simply resolve this error by setting the option in the 'Attach to Process' to the 'Automatically determine the type of code to debug' option, Simply follow the steps below:
- Go to Debug from the menu bar
- Click on Attach to Process
- Near the Attach to option, click on the Select button
- The Select Code Type window will appear
- Now select the option Automatically determine the type of code to debug and click the OK button.
- Use Debug -> Windows -> Modules.
You will see a list of all the assemblies that are loaded into the process.
Locate the one you want to get debug info for.
Right-click it and select Symbol Load Information. You'll get a dialog that lists all the directories where it looked for the .pdb file for the assembly.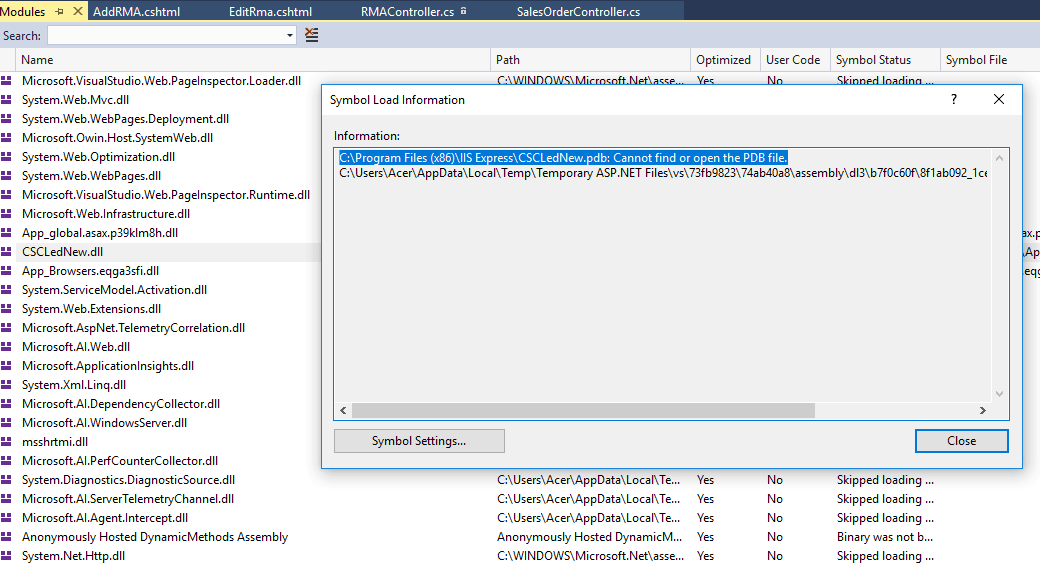
Verify that list against the actual .pdb location. Make sure it doesn't find an old one. - Make sure, "Optimize Code" is unchecked in project properties. Navigate to Properties -> Build -> Check for "Optimize code" is un-checked.
- You can also try this (Not a solution, just a workaround), Go to "Tools" -> "Options" -> "Debugging" -> "General" -> Uncheck "Require source files to exactly match the original version"
- If you are debugging Unit Test in C# project, make sure Test project DLL's are loading and also right-click on Unit Test project
- Select "Properties"
- Select "Build"
- Select "Advanced"
- In the pop-up make sure "Debugging Information" is set to "Full" option
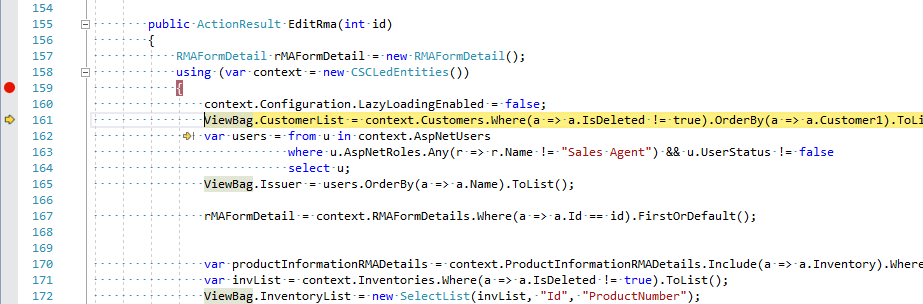
These are the list of ways, which might resolve your error, when I encountered this error, my solution was "solution 1" and the solution 1 method above to clean and re-build the solution worked for me and I was able to debug the breakpoint, as shown below.
If we have missed any solution, which resolves this error, please suggest your solution in the comments below.
You might also like to read:
How to debug in visual studio? ( Tutorial to debug C# code )
Local Storage in HTML5 using Javascript (Storing-fetching objects)
 Buy us a coffee
 Become a Patron