
I have make a chart.js in my website to display chart showing demand of a fruit over date range using this script below :
<div class="chart-wrapper" style="height:200px;margin-top:40px;">
    <canvas id="main-chart" class="chart" height="100"></canvas>
</div>
<script src="https://cdnjs.cloudflare.com/ajax/libs/Chart.js/2.4.0/Chart.min.js">
</script>
<script>
    var ctx = document.getElementById("main-chart").getContext('2d');
    var myChart = new Chart(ctx, {
        type: 'line',
        data: {
            labels: ["M", "T", "W", "T", "F", "S", "S", "M"],
            datasets: [{
                label: 'Traffic',
                data: [0, 50, 100, 150, 200, 250, 300, 350],
                backgroundColor: [
                    'rgba(255, 99, 132, 0.2)',
                    'rgba(54, 162, 235, 0.2)',
                    'rgba(255, 206, 86, 0.2)',
                    'rgba(75, 192, 192, 0.2)',
                    'rgba(153, 102, 255, 0.2)',
                    'rgba(255, 159, 64, 0.2)'
                ],
                borderColor: [
                    'rgba(255,99,132,1)',
                    'rgba(54, 162, 235, 1)',
                    'rgba(255, 206, 86, 1)',
                    'rgba(75, 192, 192, 1)',
                    'rgba(153, 102, 255, 1)',
                    'rgba(255, 159, 64, 1)'
                ],
                borderWidth: 1
            }]
        },
        options: {
            scales: {
                yAxes: [{
                    ticks: {
                        beginAtZero: true
                    }
                }]
            }
        }
    });
</script>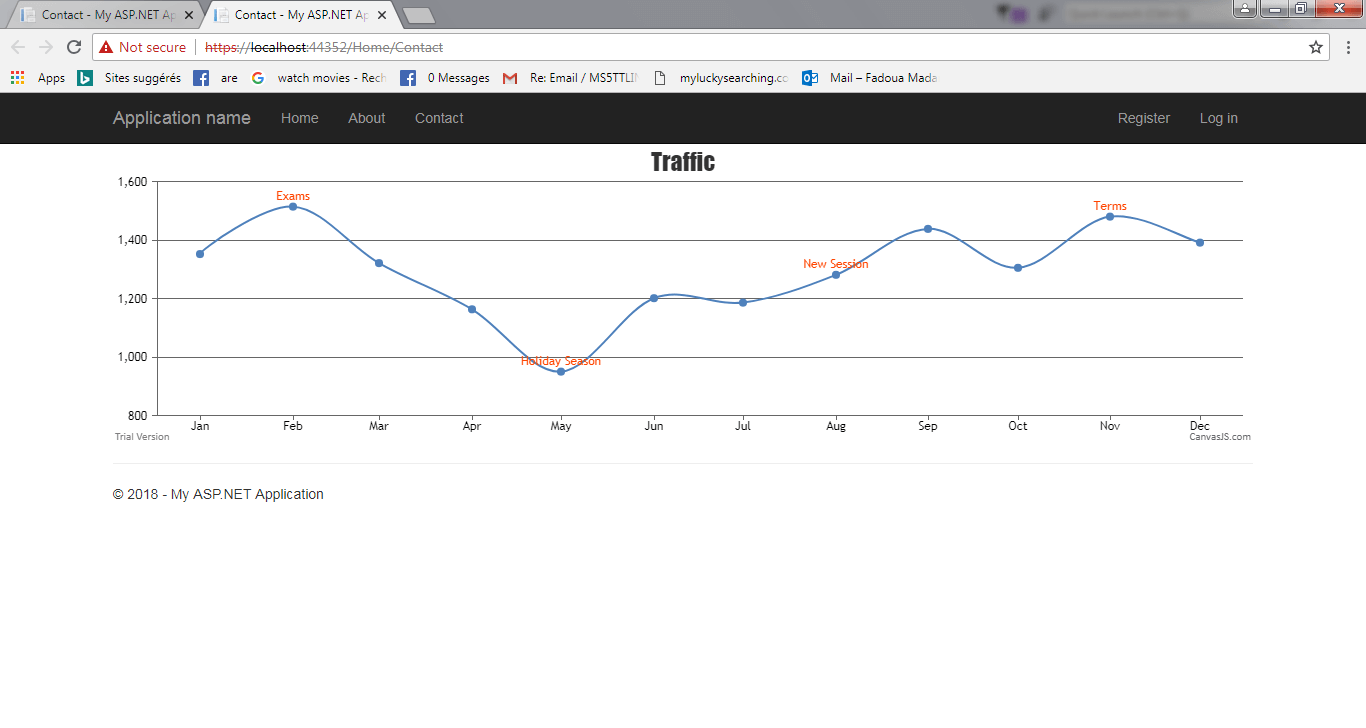
And I have that table DemandFruit (idfruit,date,kindFruit) I want to show in this chart the evolution of demand a fruit by date for example if the client demand same fruit 12 once in 2012 and 16 same fruit in 2014 the chart show that but not entring manually the data should do that by using my database.
I want that labels: ["M", "T", "W", "T", "F", "S","S","M"], and data: [0, 50, 100, 150, 200, 250,300,350 ], comes from my database not writen manually
It is possible to do that . Thanks.
 Answered by:- LuneAgile
Hi, I have found method to connect my char.js in asp.net mvc .
I put in the Controller Home this method :
[HttpPost]
public JsonResult NewChart()
{
List<object> iData = new List<object>();
//Creating sample data
DataTable dt = new DataTable();
dt.Columns.Add("String", System.Type.GetType("System.String"));
dt.Columns.Add("Count", System.Type.GetType("System.Int32"));
DataRow dr = dt.NewRow();
dr["String"] = "Sam";
dr["Count"] = 123;
dt.Rows.Add(dr);
dr = dt.NewRow();
dr["String"] = "Alex";
dr["Count"] = 456;
dt.Rows.Add(dr);
dr = dt.NewRow();
dr["String"] = "Michael";
dr["Count"] = 587;
dt.Rows.Add(dr);
//Looping and extracting each DataColumn to List<Object>
foreach (DataColumn dc in dt.Columns)
{
List<object> x = new List<object>();
x = (from DataRow drr in dt.Rows select drr[dc.ColumnName]).ToList();
iData.Add(x);
}
//Source data returned as JSON
return Json(iData, JsonRequestBehavior.AllowGet);
}
And inside the view I put that code :
<!DOCTYPE html>
<html>
<head>
<meta name="viewport" content="width=device-width" />
<title>Line Charts</title>
<script src="https://cdnjs.cloudflare.com/ajax/libs/Chart.js/2.6.0/Chart.min.js" type="text/javascript"></script>
<script src="https://code.jquery.com/jquery-1.11.3.min.js"></script>
<script>
$.ajax({
type: "POST",
url: "/Home/NewChart",
contentType: "application/json; charset=utf-8",
dataType: "json",
success: function (chData) {
var aData = chData;
var aLabels = aData[0];
var aDatasets1 = aData[1];
var dataT = {
labels: aLabels,
datasets: [{
label: "Test Data",
data: aDatasets1,
fill: false,
backgroundColor: ["rgba(54, 162, 235, 0.2)", "rgba(255, 99, 132, 0.2)", "rgba(255, 159, 64, 0.2)", "rgba(255, 205, 86, 0.2)", "rgba(75, 192, 192, 0.2)", "rgba(153, 102, 255, 0.2)", "rgba(201, 203, 207, 0.2)"],
borderColor: ["rgb(54, 162, 235)", "rgb(255, 99, 132)", "rgb(255, 159, 64)", "rgb(255, 205, 86)", "rgb(75, 192, 192)", "rgb(153, 102, 255)", "rgb(201, 203, 207)"],
borderWidth: 1
}]
};
var ctx = $("#myChart").get(0).getContext("2d");
var myNewChart = new Chart(ctx, {
type: 'line',
data: dataT,
options: {
responsive: true,
title: { display: true, text: 'Traffic' },
legend: { position: 'bottom' },
scales: {
xAxes: [{ gridLines: { display: false }, display: true, scaleLabel: { display: false, labelString: '' } }],
yAxes: [{ gridLines: { display: false }, display: true, scaleLabel: { display: false, labelString: '' }, ticks: { stepSize: 50, beginAtZero: true } }]
},
}
});
}
});
</script>
</head>
<body>
<div Style="font-family: Corbel; font-size: small ;text-align:center " class="row">
<div style="width:100%;height:100%">
<canvas id="myChart" style="padding: 0;margin: auto;display: block; "> </canvas>
</div>
</div>
All work fine but can someone help me to replace filling the columns of datatable with select query from sql server. I'm trying that code but still not working.
// The class
using System;
using System.Collections.Generic;
using System.Linq;
using System.Web;
namespace ChartJSCorner.Controllers
{
public class Detail
{
public string String{ get; set; }
public string Count{ get; set; }
}
}
// the method inside Home Controller
[HttpPost]
public JsonResult Su()
{
string myConnStr = ConfigurationManager.ConnectionStrings["connx"].ConnectionString;
// Create new connection to database and open database
SqlConnection myConn = new SqlConnection();
myConn.ConnectionString = myConnStr; // Set connection string
myConn.Open();
String sql = "SELECT * FROM Detail";
SqlCommand cmd = new SqlCommand(sql, myConn);
var model = new List<Detail>();
SqlDataReader rdr = cmd.ExecuteReader();
while (rdr.Read())
{
var Detail= new Detail();
Detail.String= rdr["String"].ToString();
Detail.Count= rdr["Count"].ToString();
model.Add(Detail);
}
List<object> iData = new List<object>();
//Creating sample data
DataTable dt = new DataTable();
dt.Columns.Add(rdr["String"].ToString(), System.Type.GetType("System.String"));
dt.Columns.Add(rdr["Count"].ToString(), System.Type.GetType("System.Int32"));
foreach (DataColumn dc in dt.Columns)
{
List<object> x = new List<object>();
x = (from DataRow drr in dt.Rows select drr[dc.ColumnName]).ToList();
iData.Add(x);
}
//Source data returned as JSON
return Json(iData, JsonRequestBehavior.AllowGet);
}
// Thanks
Subscribe to our weekly Newsletter & Keep getting latest article/questions in your inbox weekly
 Buy us a coffee
 Become a Patron