
Hi, I'm trying to use list of object returned by Json to bind chart.js but I don't know how can I get the first element of object and second element of object and show it in chart.js.
My code is as below :
Class
public class Dog
{
    public string Name { get; set; }
    public int Age { get; set; }
}
C# controller :
public JsonResult EditDogs()
{
    IList<Dog> Dogs = new List<Dog>()
                {
                    new Dog { Name = "Rocky", Age = 3 },
                    new Dog { Name = "Rambo", Age = 4},
                    new Dog { Name = "FFF", Age = 7}
                    new Dog { Name = "KKK", Age = 8}

                };
    return Json(dogs, JsonRequestBehavior.AllowGet);
}
View(.cshtml) :
@model List<WebApplication2.Models.Dog>

@{
ViewBag.Title = "Home Page";
}
<!DOCTYPE html>
<html>
<head>
<meta name="viewport" content="width=device-width" />
<title>Line Charts</title>
<script src="https://cdnjs.cloudflare.com/ajax/libs/Chart.js/2.6.0/Chart.min.js" type="text/javascript"></script>
<script src="https://code.jquery.com/jquery-1.11.3.min.js"></script>
<script>

$.ajax({
type: "POST",
url: "/Home/EditDogs",
contentType: "application/json; charset=utf-8",
dataType: "json",
success: function (chData) {
var aData = chData;
@for (int i = 0; i < Model.Count(); i++)
{
var aLabels = Model[i].Name;
var aDatasets1 = Model[i].Age;
}
var dataT = {
labels: aLabels,
datasets: [{
label: "Test Data",
data: aDatasets1,
fill: false,
backgroundColor: ["rgba(12, 162, 235, 0.2)", "rgba(255, 99, 132, 0.2)", "rgba(255, 159, 64, 0.2)", "rgba(255, 205, 86, 0.2)", "rgba(75, 192, 192, 0.2)", "rgba(153, 102, 255, 0.2)", "rgba(201, 203, 207, 0.2)"],
borderColor: ["rgb(54, 162, 235)", "rgb(255, 99, 132)", "rgb(255, 159, 64)", "rgb(255, 205, 86)", "rgb(75, 192, 192)", "rgb(153, 102, 255)", "rgb(201, 203, 207)"],
borderWidth: 4
}]
};
var ctx = $("#myChart").get(0).getContext("2d");
var myNewChart = new Chart(ctx, {


type: 'line',
data: dataT,
options: {


responsive: true,
title: { display: true, text: 'Traffic' },
legend: { position: 'bottom' },
scales: {
xAxes: [{ gridLines: { display: false }, display: true, scaleLabel: { display: false, labelString: '' } }],
yAxes: [{ gridLines: { display: false }, display: true, scaleLabel: { display: false, labelString: '' }, ticks: { stepSize: 50, beginAtZero: true } }]
},
}
});
}
});
</script>
</head>
<body>
<div Style="font-family: Corbel; font-size: small ;text-align:center " class="row">
<div style="width:100%;height:100%">
<canvas id="myChart" style="padding: 0;margin: auto;display: block; "> </canvas>
</div>
</div>
</body>
I have error on this prt of code
@for (int i = 0; i < Model.Count(); i++)
{
  var aLabels = Model[i].Name;
  var aDatasets1 = Model[i].Age;
}
I'm not able to get the first element of object and the second element of the object
var aLabels should equal to =  dog.Name
var aDatasets1 should equal to = dog.Age
how I can do that. Thanks In advance.
 Answered by:- LuneAgile
Hi. I have fixed my error with that code in view :
Hi. I have changed my view as below :
@model List<WebApplication2.Models.Dog>
@{
ViewBag.Title = "Home Page";
}
<!DOCTYPE html>
<html>
<head>
<meta name="viewport" content="width=device-width" />
<title>Line Charts</title>
<script src="https://cdnjs.cloudflare.com/ajax/libs/Chart.js/2.6.0/Chart.min.js" type="text/javascript"></script>
<script src="https://code.jquery.com/jquery-1.11.3.min.js"></script>
<script>
$.ajax({
type: "POST",
url: "/Home/EditDogs",
contentType: "application/json; charset=utf-8",
dataType: "json",
success: function (chData) {
var aData = chData;
var dataT = {
labels: [aData[0].Name, aData[1].Name,aData[2].Name, aData[3].Name],
datasets: [{
label: "Test Data",
data: [aData[0].Age, aData[1].Age,aData[2].Age, aData[3].Age],
fill: false,
backgroundColor: ["rgba(12, 162, 235, 0.2)", "rgba(255, 99, 132, 0.2)", "rgba(255, 159, 64, 0.2)", "rgba(255, 205, 86, 0.2)", "rgba(75, 192, 192, 0.2)", "rgba(153, 102, 255, 0.2)", "rgba(201, 203, 207, 0.2)"],
borderColor: ["rgb(54, 162, 235)", "rgb(255, 99, 132)", "rgb(255, 159, 64)", "rgb(255, 205, 86)", "rgb(75, 192, 192)", "rgb(153, 102, 255)", "rgb(201, 203, 207)"],
borderWidth: 4
}]
};
var ctx = $("#myChart").get(0).getContext("2d");
var myNewChart = new Chart(ctx, {
type: 'line',
data: dataT,
options: {
responsive: true,
title: { display: true, text: 'Traffic' },
legend: { position: 'bottom' },
scales: {
xAxes: [{ gridLines: { display: false }, display: true, scaleLabel: { display: false, labelString: '' } }],
yAxes: [{ gridLines: { display: false }, display: true, scaleLabel: { display: false, labelString: '' }, ticks: { stepSize: 50, beginAtZero: true } }]
},
}
});
}
});
</script>
</head>
<body>
<div Style="font-family: Corbel; font-size: small ;text-align:center " class="row">
<div style="width:100%;height:100%">
<canvas id="myChart" style="padding: 0;margin: auto;display: block; "> </canvas>
</div>
</div>
</body>
</html>
Answered by:- LuneAgile
Hi. I have changed my view as below :
@model IEnumerable<WebApplication2.Models.Dog>
@{
ViewBag.Title = "Home Page";
}
<!DOCTYPE html>
<html>
<head>
<meta name="viewport" content="width=device-width" />
<title>Line Charts</title>
<script src="https://cdnjs.cloudflare.com/ajax/libs/Chart.js/2.6.0/Chart.min.js" type="text/javascript"></script>
<script src="https://code.jquery.com/jquery-1.11.3.min.js"></script>
<script>
$.ajax({
type: "POST",
url: "/Home/EditDogs",
contentType: "application/json; charset=utf-8",
dataType: "json",
success: function (chData) {
var aData = chData;
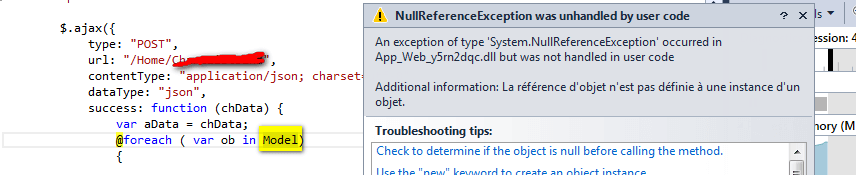
@foreach ( var ob in Model)
{
var aLabels = ob.Name;
var aDatasets1 = ob.Age;
}
var dataT = {
labels: aLabels,
datasets: [{
label: "Test Data",
data: aDatasets1,
fill: false,
backgroundColor: ["rgba(12, 162, 235, 0.2)", "rgba(255, 99, 132, 0.2)", "rgba(255, 159, 64, 0.2)", "rgba(255, 205, 86, 0.2)", "rgba(75, 192, 192, 0.2)", "rgba(153, 102, 255, 0.2)", "rgba(201, 203, 207, 0.2)"],
borderColor: ["rgb(54, 162, 235)", "rgb(255, 99, 132)", "rgb(255, 159, 64)", "rgb(255, 205, 86)", "rgb(75, 192, 192)", "rgb(153, 102, 255)", "rgb(201, 203, 207)"],
borderWidth: 4
}]
};
var ctx = $("#myChart").get(0).getContext("2d");
var myNewChart = new Chart(ctx, {
type: 'line',
data: dataT,
options: {
responsive: true,
title: { display: true, text: 'Traffic' },
legend: { position: 'bottom' },
scales: {
xAxes: [{ gridLines: { display: false }, display: true, scaleLabel: { display: false, labelString: '' } }],
yAxes: [{ gridLines: { display: false }, display: true, scaleLabel: { display: false, labelString: '' }, ticks: { stepSize: 50, beginAtZero: true } }]
},
}
});
}
});
</script>
</head>
<body>
<div Style="font-family: Corbel; font-size: small ;text-align:center " class="row">
<div style="width:100%;height:100%">
<canvas id="myChart" style="padding: 0;margin: auto;display: block; "> </canvas>
</div>
</div>
</body>
</html>
But i'm facing with this exeption Please can help me to fix that Thanks.
my Model is null
Answered by:- LuneAgile
Hi. I have changed my view as below :
@model IEnumerable<WebApplication2.Models.Dog>
@{
ViewBag.Title = "Home Page";
}
<!DOCTYPE html>
<html>
<head>
<meta name="viewport" content="width=device-width" />
<title>Line Charts</title>
<script src="https://cdnjs.cloudflare.com/ajax/libs/Chart.js/2.6.0/Chart.min.js" type="text/javascript"></script>
<script src="https://code.jquery.com/jquery-1.11.3.min.js"></script>
<script>
$.ajax({
type: "POST",
url: "/Home/EditDogs",
contentType: "application/json; charset=utf-8",
dataType: "json",
success: function (chData) {
var aData = chData;
@foreach (var b in Dogs )
{
var aLabels = b.Name;
var aDatasets1 = b.Age;
}
var dataT = {
labels: aLabels,
datasets: [{
label: "Test Data",
data: aDatasets1,
fill: false,
backgroundColor: ["rgba(12, 162, 235, 0.2)", "rgba(255, 99, 132, 0.2)", "rgba(255, 159, 64, 0.2)", "rgba(255, 205, 86, 0.2)", "rgba(75, 192, 192, 0.2)", "rgba(153, 102, 255, 0.2)", "rgba(201, 203, 207, 0.2)"],
borderColor: ["rgb(54, 162, 235)", "rgb(255, 99, 132)", "rgb(255, 159, 64)", "rgb(255, 205, 86)", "rgb(75, 192, 192)", "rgb(153, 102, 255)", "rgb(201, 203, 207)"],
borderWidth: 4
}]
};
var ctx = $("#myChart").get(0).getContext("2d");
var myNewChart = new Chart(ctx, {
type: 'line',
data: dataT,
options: {
responsive: true,
title: { display: true, text: 'Traffic' },
legend: { position: 'bottom' },
scales: {
xAxes: [{ gridLines: { display: false }, display: true, scaleLabel: { display: false, labelString: '' } }],
yAxes: [{ gridLines: { display: false }, display: true, scaleLabel: { display: false, labelString: '' }, ticks: { stepSize: 50, beginAtZero: true } }]
},
}
});
}
});
</script>
</head>
<body>
<div Style="font-family: Corbel; font-size: small ;text-align:center " class="row">
<div style="width:100%;height:100%">
<canvas id="myChart" style="padding: 0;margin: auto;display: block; "> </canvas>
</div>
</div>
</body>
</html>
But i'm facing with this exeption Please can help me to fix that Thanks.
CS0103: The name 'Dogs' does not exist in the current context I have imported the name space of my controller @using ChartJSCorner.Controllers inside the view but still give me this error. Thanks in advance
Subscribe to our weekly Newsletter & Keep getting latest article/questions in your inbox weekly
 Buy us a coffee
 Become a Patron