
In this article, I have explained how you can create a chart in asp.net easily by taking dynamic data from SQL server database table, we will be using Pie Chart sample in this article. You can also read article, Google charts in ASP.NET MVC, if you are looking for creating pie chart in ASP.NET MVC.
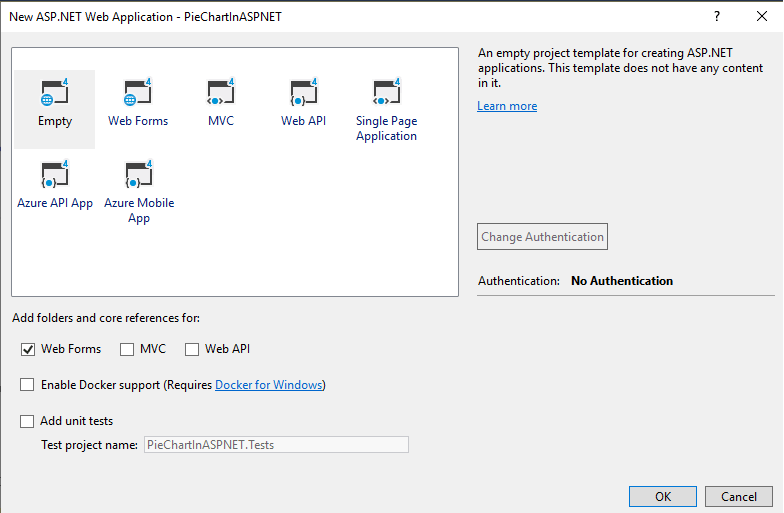
So, to begin creating Pie chart in ASP.NET, we will create a new web-application project in Visual Studio, navigate to File-> New -> Project -> Select "Web" from left pane and "ASP.NET web-application" from right-pane, name it and click OK.
In the next screen select "Empty" and also check "Web-Forms", as shown in the below image
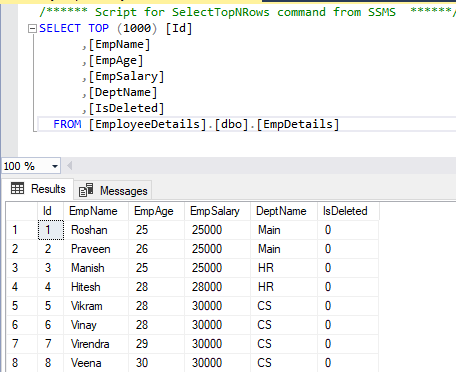
Before we proceed, take a look at the sample database table, which we will be using in this example
Now, create a new Default.aspx web-form page in your Solution, right-click on your Project name, then Select "Add"-> "New Item"-> Select "Web-Form" type file, name it "Default.aspx".
Now, we will add a new Control "Charts", so drag and drop the new control from Toolbox, as shown in the below image:
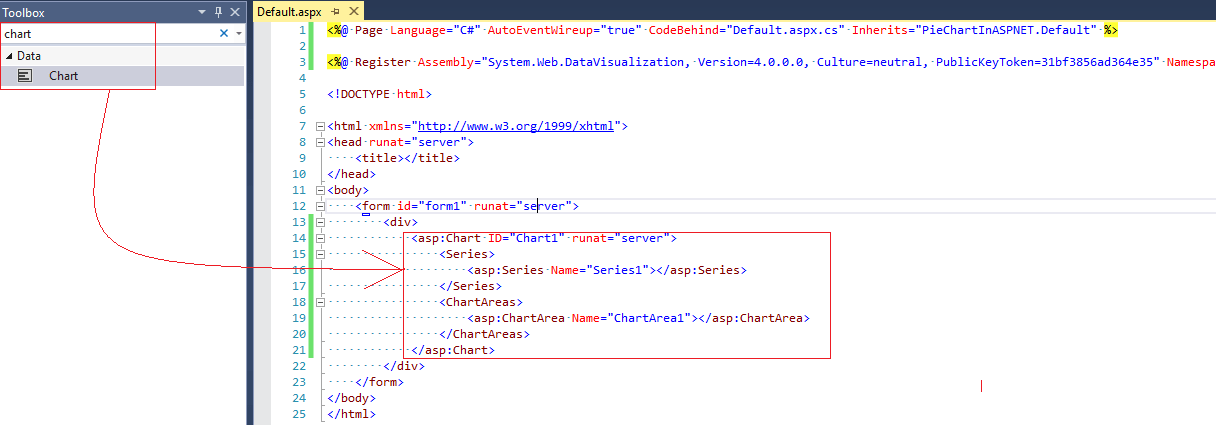
So our complete "Default.aspx" code will look like this
<%@ Page Language="C#" AutoEventWireup="true" CodeBehind="Default.aspx.cs" Inherits="PieChartInASPNET.Default" %>

<%@ Register Assembly="System.Web.DataVisualization, Version=4.0.0.0, Culture=neutral, PublicKeyToken=31bf3856ad364e35" Namespace="System.Web.UI.DataVisualization.Charting" TagPrefix="asp" %>

<!DOCTYPE html>

<html xmlns="http://www.w3.org/1999/xhtml">
<head runat="server">
    <title></title>
</head>
<body>
    <form id="form1" runat="server">
        <div>
            <asp:Chart ID="Chart1" runat="server">
                 <Legends>
                    <asp:Legend Alignment="Center" Docking="Bottom" IsTextAutoFit="False" Name="Default"
                        LegendStyle="Row" />
                </Legends>
                <Series>
                    <asp:Series Name="Default"></asp:Series>
                </Series>
                <ChartAreas>
                    <asp:ChartArea Name="ChartArea1" BorderWidth="0"></asp:ChartArea>
                </ChartAreas>
            </asp:Chart>
        </div>
    </form>
</body>
</html>
We have added Chart Control in the View, now we will try to fill values in it on "Page-load" using C#, so navigate to "Default.aspx.cs" and use the code below
using System;
using System.Configuration;
using System.Data;
using System.Data.SqlClient;
using System.Web.UI.DataVisualization.Charting;

namespace PieChartInASPNET
{
    public partial class Default : System.Web.UI.Page
    {
        //on page load initialize chart
        protected void Page_Load(object sender, EventArgs e)
        {
            //get connection string from web config
            string constr = ConfigurationManager.ConnectionStrings["constr"].ConnectionString;

            using (SqlConnection con = new SqlConnection(constr))
            {
                //query to fetch Employee Salary and getting Count of each salary in table, the group by with Emp Salary
                using (SqlCommand cmd = new SqlCommand("SELECT EmpSalary,count(EmpSalary) FROM EmpDetails Group by EmpSalary"))
                {
                    using (SqlDataAdapter sda = new SqlDataAdapter())
                    {
                        cmd.Connection = con;
                        sda.SelectCommand = cmd;

                        DataSet ds = new DataSet();
                        sda.Fill(ds);

                        DataTable ChartData = ds.Tables[0];

                        //storing total rows count to loop on each Record
                        string[] XPoints = new string[ChartData.Rows.Count];

                        int[] YPOints = new int[ChartData.Rows.Count];

                        for (int count = 0; count < ChartData.Rows.Count; count++)
                        {
                            // store values for X axis
                            XPoints[count] = ChartData.Rows[count]["EmpSalary"].ToString();
                            //store values for Y Axis
                            YPOints[count] = Convert.ToInt32(ChartData.Rows[count][1]);

                        }
                        //binding chart control
                        Chart1.Series[0].Points.DataBindXY(XPoints, YPOints);

                        //Setting width of line
                        Chart1.Series[0].BorderWidth = 5;
                        //setting Chart type
                        Chart1.Series[0].ChartType = SeriesChartType.Pie;

                        //enable to show legend
                        Chart1.Legends[0].Enabled = true;

                        //show pie chart in 3d
                        Chart1.ChartAreas["ChartArea1"].Area3DStyle.Enable3D = true;

                    }
                }
            }
        }
    }
}
In the above C#, We are first connecting to our database and executing query to get "EmpSalary" and it's count, using database table "EmpDetails" of database "EmployeeDetails"
The EmpSalary values are assigned to the X point values of the Chart while the Total Number of "EmpSalary Count value" are assigned to the Y point values of the Chart.
Here Xpoints = X axis, Horizontal line of chart, while Ypoints represent Vertical line of chart.
Once we have filled the value, we bind XPoint and YPoint array values to Chart.
We are also specifying chart type and enabling it to show as 3D chart.
We have also enabled Legends in the C# Code by making ' Chart1.Legends[0].Enabled = true;'
Once we are done with above configuration, in your web.Config, add following configuration otherwise you may get error "No http handler was found for request type 'GET'"
 <!--Connection strings-->
  <connectionStrings>
    <add name="constr"
    providerName="System.Data.SqlClient"
    connectionString="Data Source=localhost;Initial Catalog=databasename;Integrated Security=False;User Id=userid;Password=password;MultipleActiveResultSets=True" />
  </connectionStrings>

 <appSettings>
    <add key="ChartImageHandler" value="storage=file;timeout=20;" />
  </appSettings>

  <system.webServer>
    <handlers>
      <add name="ChartImg" verb="*" path="ChartImg.axd"  type="System.Web.UI.DataVisualization.Charting.ChartHttpHandler, System.Web.DataVisualization, Version=4.0.0.0, Culture=neutral, PublicKeyToken=31bf3856ad364e35"  />
    </handlers>
  </system.webServer>


<system.web>

    <pages enableViewState="true">
      <controls>
        <add tagPrefix="asp" namespace="System.Web.UI.DataVisualization.Charting" assembly="System.Web.DataVisualization, Version=4.0.0.0, Culture=neutral, PublicKeyToken=31bf3856ad364e35" />
      </controls>
    </pages>

    <compilation debug="true" targetFramework="4.6.1">
      <assemblies>
        <add assembly="System.Web.DataVisualization, Version=4.0.0.0, Culture=neutral, PublicKeyToken=31BF3856AD364E35"/>
      </assemblies>
    </compilation>

  </system.web>
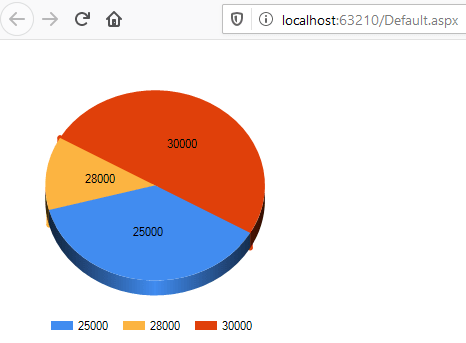
That's it, we are done, build and run your project in browser, output should be as shown below
You may also like to read:
Bind data to GridView using jQuery Ajax
Understanding GridView in ASP.NET
What is .NET framework? And Understanding .NET Architecture
 Buy us a coffee
 Become a Patron