
When we are developing any web-application, we usually have a dashboard in the Admin panel, to show sales reports in a Chart or say a number of items sold this week, earnings of the last week vs the current week, the total number of new users signed up for the application etc.So to provide better and quick visualization of these data, we need to create charts in our application, and in this article, I am going to demonstrate you, how to show live data from database & integrate it in Google Chart(pie chart) using your ASP.NET MVC application(in JSON format).
Google Chart API provides many types of charts in which we can represent the data in the application. Some of them are given below:
- Geo Chart
- Column Chart
- Bar Chart
- Line Chart
- Pie Chart
- Area Chart
There are 3 major steps in creating pie(or any other) chart in your web application using Google Charts API
- Fetch Data from database using C#(Controller or Web Method)
- Get data on front end using jQuery Ajax (in JSON or any other format, we will be using JSON in this example)
- Add Columns, Value in google chart Datatable and draw the chart using javascript/jQuery.
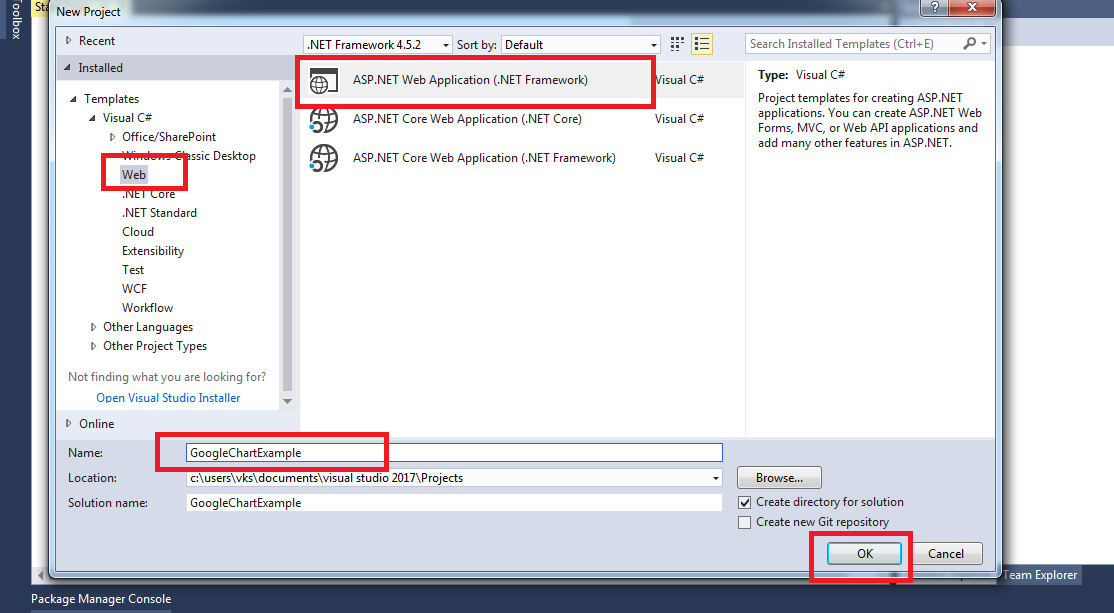
Let's create a sample project(GoogleChartExample) for it using Visual Studio 2017(You can use older version also if you don't have VS 2017).
- File -> New Project -> Web(Left Hand menu)/Asp.NET Web application (Right hand menu)
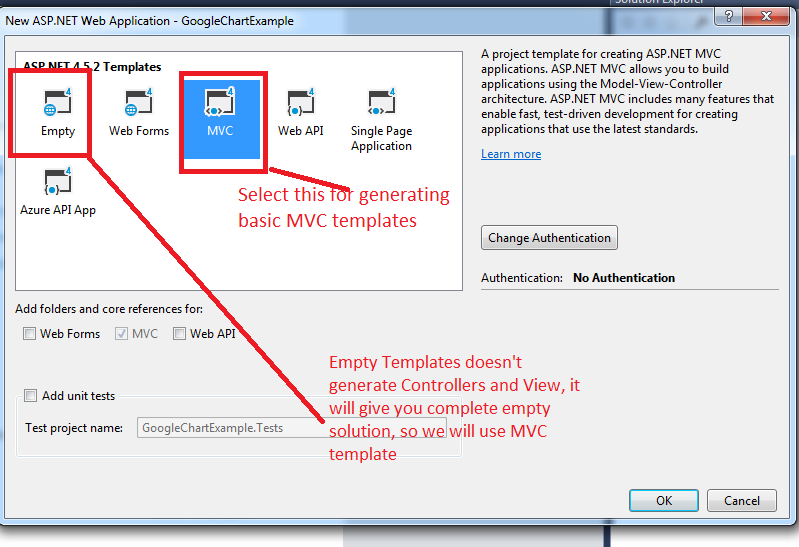
- Select MVC template for auto-generating basic Controller and View of MVC
- Connect your Solution to database using Entity Framework, check this article here if you are new to Edmx
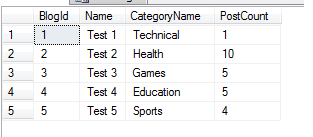
- Suppose we have this table in our Database, and we want to show its PostCount data by CategoryName in Google Charts(pie chart here)
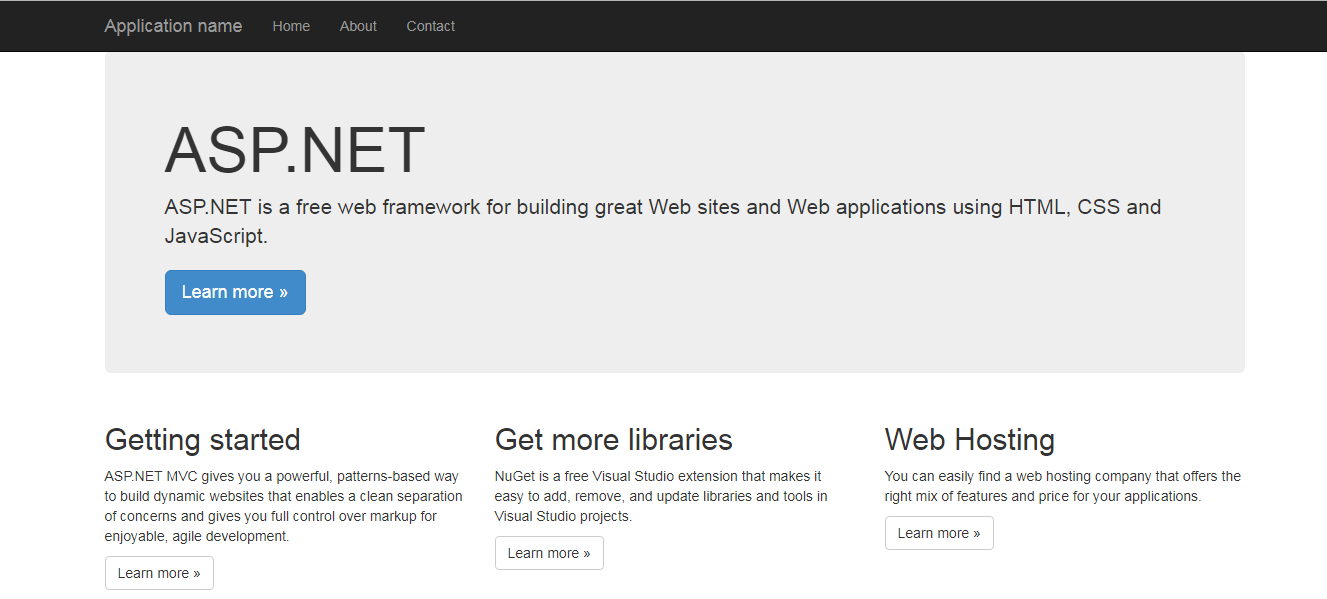
- Now Press Ctrl+F5, it will build your project and open Index View of HomeController in your default Web-Browser
If you are new to MVC, you can read about the basics of MVC in our previous article - Now, what we need to do here is:
1. to erase this auto-generated HTML
2. create the HTML div for pie chart
3. place the Ajax call while loading the page
4. Fetch data into a List using C#
5. pass this list as a JSON to front end
6. Add this list data in Google Chart API Column using Javascript
7. Draw the Chart from the above-created column's and show it
Note: don't forget to include Google chart scripts into to your View/Application, here is the link<script type="text/javascript" src="https://www.gstatic.com/charts/loader.js"></script> - Go step by step as described above
HTML for Pie Chart in Index view can be
<div id="chartdiv" style="width: 600px; height: 350px;">
</div>
Create an Ajax Call on Load of a View using jQuery to call Controller Method which will return JSON list
//reference of Google charts in javascript
<script type="text/javascript" src="https://www.gstatic.com/charts/loader.js"></script>
<script type="text/javascript">
    google.charts.load('current', { 'packages': ['corechart'] });

    //Call function after Google Chart is loaded, it is required, otherwise you may get error
    google.charts.setOnLoadCallback(DrawonLoad);


    function  DrawonLoad()
    {
        $(function () {
            $.ajax({
                type: 'GET',
                url: '/Home/GetPiechartJSON',
                success: function (chartsdata) {
                    // Callback that creates and populates a data table,
                    // instantiates the pie chart, passes in the data and
                    // draws it.

                    //get JSONList from Object
                    var Data = chartsdata.JSONList;
                    var data = new google.visualization.DataTable();

                    data.addColumn('string', 'CategoryName');
                    data.addColumn('number', 'PostCount');

                    /Loop through each list data
                    for (var i = 0; i < Data.length; i++) {
                        data.addRow([Data[i].CategoryName, Data[i].PostCount]);
                    }

                    // Instantiate and draw our chart, passing in some options
                    var chart = new google.visualization.PieChart(document.getElementById('chartdiv'));

                    //Draw pie chart command with data and chart options
                    chart.draw(data,
                        {
                            title: "Google pie Chart in ASP.NET MVC",
                            position: "top",
                            fontsize: "14px",
                        });

                },
                error: function () {
                    alert("Error loading data! Please try again.");
                }
            });
        })

    }
</script>
CreateGetPiechartJSONMethod inHomeControllerto fetch data from database, return the data as JSON
    public JsonResult GetPiechartJSON()
        {
            List<BlogPieChart> list = new List<BlogPieChart>();
            using (var context = new BlogDbEntities())
            {
                list = context.Blogs.Select(a=>new BlogPieChart { CategoryName=a.CategoryName, PostCount=a.PostCount }).ToList();

            }

            return Json(new { JSONList=list},JsonRequestBehavior.AllowGet);
        }?
Note: I have created a new Class named as
BlogPieChart.csto get only CategoryName and PostCount, here is the code for itpublic class BlogPieChart { public string CategoryName { get; set; } public int? PostCount { get; set; } }Now Run your application using Ctrl+f5, it will open in your browser, and the output would be like
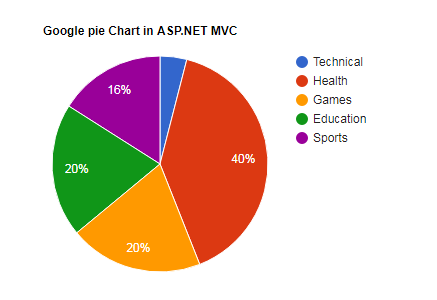
- That's it, you have just created your pie chart using Google charts
Understanding the Javascript code
Although I have explained my javascript code above with comments, I would like to clarify it a bit more
google.charts.load('current', { 'packages': ['corechart'] });
google.charts.setOnLoadCallback(DrawonLoad);
the above javascript code loads the google charts on our web page and it will call DrawonLoad a function after charts are loaded, it is required to write above lines, remove it and calling Ajax call directly may throw javascript error "Cannot read property 'DataTable' of undefined" related to Google charts.
var Data = chartsdata.JSONList;
var data = new google.visualization.DataTable();
Above code will Fetch JSONList and creates a variable to initialize datatable of Google Charts
Now add the columns in your Google Charts using, with their data-type
  data.addColumn('string', 'CategoryName');
  data.addColumn('number', 'PostCount');
Below code will help your loop through the data, and add data as a row in Google charts above created datatable
  for (var i = 0; i < Data.length; i++) {
  data.addRow([Data[i].CategoryName, Data[i].PostCount]);
}
After this, we are adding initiating and drawing our chart using the ID and some extra header options
// Instantiate and draw our chart, passing in some options
                    var chart = new google.visualization.PieChart(document.getElementById('chartdiv'));

                    //Draw pie chart command with data and chart options
                    chart.draw(data,
                        {
                            title: "Google pie Chart in ASP.NET MVC",
                            position: "top",
                            fontsize: "14px",
                        });
Making it as 3D Pie Chart
To convert the above Pie Chart in 3d, we just need to make sure "is3D" = true in Google chart options when initializing it, so basically, in the above code, we need to add just one line, as shown below
// Instantiate and draw our chart, passing in some options
                    var chart = new google.visualization.PieChart(document.getElementById('chartdiv'));

                    //Draw pie chart command with data and chart options
                    chart.draw(data,
                        {
                            title: "Google pie Chart in ASP.NET MVC",
                            position: "top",
                            fontsize: "14px",

                            is3D: true // this makes pie chart 3D

                        });
That's we are done if you find any issue in the code, or while creating google chart in your MVC application, feel free to add a comment or ask your question on it, we will help you.
 Buy us a coffee
 Become a Patron