
I have a survey in my MVC app and I need to display its results to a pie chart. This is what I have done by so far (according to this)
I would like to ask if it possible to bring the data for my Survey Model
 [Key, DatabaseGenerated(DatabaseGeneratedOption.None)]
        [Display(Name = "ID")]
        public int SurveyID { get; set; }

[Required]
        [Display(Name = "Secretary")]
        public string Frequency { get; set; }
thank you
 Answered by:- jon
Looking at your above small details, I think article is good enough to explain all the details, but I think you can do something like this on your google chart
1. First, create an action in your controller which returns JSON as data
public JsonResult PiechartJSON()
        {
            List<YourModel> list = new List<YourModel>();
            using (var context = new DbEntities())
            {
                list = context.YourDBTable.Select(a=>new YourModel{ SurveyID=a.SurveyID, Frequency = a.Frequency }).ToList();

            }

            return Json(new { JSONList=list},JsonRequestBehavior.AllowGet);
        }
2. Create a Column for SurveyID and create a Column for Frequency in your jQuery in front end
var data = new google.visualization.DataTable();

      data.addColumn('number', 'SurveyID');
            data.addColumn('number', 'Frequency');
Remember you need to load these as columns to show it's data as row in pie chart
3. Loop through your JSON data and add it as row, which you got from C# using Ajax, you would need both values SurveyID and Frequency
           //Loop through each list data
            for (var i = 0; i < Data.length; i++) {

                data.addRow([parseInt(Data[i].SurveyID, 10), parseInt(Data[i].Frequency, 10)]);
            }
4. Load chart.
 Answered by:- bhanu
So, you want to loop on all Ids first as column and then add frequency as row,I think NO, let me tell you why look at your code closely
// if Data.Length is 3

for (i = 0; i < Data.length; i++) {
 //Create Columns says 3,
  data.addColumn([Data[i].SurveyID]);
}

for (var i = 0; i < Data.length; i++) {
//Now you are creating only 3 rows for single column, google chart will thro error for this
// as number of rows data is less than number of columns
  data.addRow([Data[i].frequency]);
}
Consider google chart as a table, now suppose if Data.Length=3 , then
you are creating 3 columns but pasing data to only one column in above code, so you need to fill data in 3 columns for each row, something like this
data.addRow([Data[i].ColumnOneValue],[Data[i].ColumnTwoValue],[Data[i].ColumnThreeValue]);
So, using your above code, it is not possible, correct your code, try what is explaind in @jon's answer or look closely on article and it's comments.
 Answered by:- mspace
Ok bhanu you were right I get the data per record now. It is possible to show the data based on the length of IDs in addition to frequency column? As you can see in my pic it displays the value often two times which is correct as I have the code from the example tutorial. But I need to display it only one time. Is that possible?
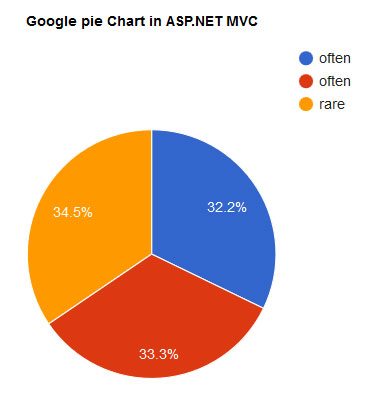
thank you
Answered by:- mspace
ok I solved by using the groupby method. Thank you all!
Answered by:- mspace
Hello thank you for your reply. Yes the article is very detailed. What I need is to display data per record. I mean something like
for (i = 0; i < Data.length; i++) {
  data.addColumn([Data[i].SurveyID]);
}

for (var i = 0; i < Data.length; i++) {
  data.addRow([Data[i].frequency]);
}
is that possible? I try it but no luck
thank you
Subscribe to our weekly Newsletter & Keep getting latest article/questions in your inbox weekly
 Buy us a coffee
 Become a Patron