
In a previous article, I have mentioned what is APM and Open Source APM tools, in this article I have provided a list of the best Application performance management tools which a .NET Core or .NET Core developer team should consider for their C#, .NET based application.
If you are a .NET Developer then you can use a lot of available tools to check your application performance and optimizing it, so here is the list of best .NET APM tools with their features.
1. Cisco's AppDynamics
![]()
AppDynamics platform provides a comprehensive solution for monitoring and managing the performance of your .NET applications.
With rapid installation and the most scalable architecture in the industry, AppDynamics solutions help you deploy your applications more quickly and with more confidence.
Features:
- AppDynamics auto-discovers two ASP.NET tiers and two backends. The NWTraders-WebLog and NWTraders-Portal tiers are ASP.NET. The flow map shows the communication as the average number of calls per minute between the tiers and the average response time for a single call.
- Using a Business transaction dashboard shows the overall health of the transaction and critical statistics, such as the number of calls per minute and the number of slow transactions, to help you monitor business transaction performance.
- AppDynamics takes transaction snapshots that contain diagnostic data to help you quickly analyze and troubleshoot problems with ASP.NET business transactions.
- Using Call graph displays the code execution sequence timing so you can identify which methods have problems.
- AppDynamics collects metrics on the overall application performance of ASP.NET applications.
2. Datadog
![]()
Datadog APM provides end-to-end distributed tracing from frontend devices to databases—with no sampling. So you can analyze and isolate dependencies, remove bottlenecks, reduce latency, track errors, and increase code efficiency to optimize your application.
Features:
- View traces and logs in context with automatic trace_id injection
- Connect distributed traces to infrastructure metrics, network calls, and live processes
- Tracing without Limits: Ingest, search, and analyze 100% of traces live over the last 15 minutes, Retain errors and high latency traces automatically for 15 days, Control cost-visibility tradeoffs with custom Retention Filters
- Inspect methods, classes, and threads for requests tied to Continuous Profiler
- Break down slow requests by time spent in code on CPU, GC, lock contention, and I/O
- Jump from high resource-consuming profiles to the worst offending traces
- Enhance application performance monitoring with regression detection after code deploys
- Track deploys: Monitor and compares impacts of canary, blue-green, and shadow deploys on application performance, Pinpoint error and latency outliers with out-of-the-box service dashboards
- Utilize hundreds of integrations with third-party frameworks or libraries for unparalleled visibility into Java, .NET, PHP, Node.js, Ruby, Python, Go, or C++ applications
3. New Relic APM

New Relic APM provides the facility to drill down the application of performance-related problems.
Features:
- Monitor your distributed services, applications, and serverless functions, no matter how or where they’re developed
- Full visibility into the performance of your digital customer experiences
- Proactively detect and explain anomalies
- Reduce alert fatigue and prioritize the issues that matter most
- All Logs just one click away.
- Allows Cross application tracing.
- Provide deployment history.
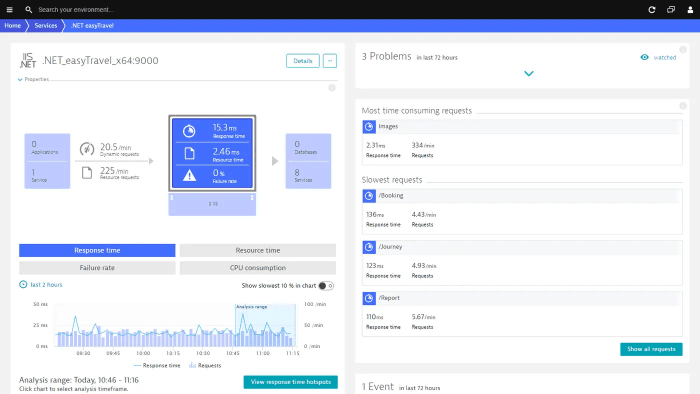
4. Dynatrace
Dynatrace gives your, .NET and IIS performance monitoring for your entire application stack, including databases, services, and browser activities.
Features:
- Dynatrace captures every transaction, across every tier, without gaps or blind spots.
- Pre-configured dashboards provide all relevant metrics down to SQL statement and code level.
- In under five minutes, Dynatrace OneAgent automatically discovers your entire .NET application stack.
- Get all .NET details: Garbage collection metrics, Web request, and response size, Busy and idle threads, .NET managed memory, Restarts, crashes, deployment changes, Response time, failure rate, etc
- Get all IIS details: CPU and memory usage, Network traffic, TCP requests, and retransmissions, CPU and memory usage, etc
- Analyze response times and find hotspots at the method level.
- Understand the impact of methods and database statements on user experience with unique backtrace capability.
5. Glimpse
Once installed, Glimpse inspects web requests as they happen, providing insights and tooling that reduce debugging time and empower every developer to improve their web applications.
Features:
- Glimpse profiles key server-side activities and displays the timing of each in an easy-to-understand Gantt chart.
- Out-of-process database calls are expensive. Glimpse lists each of them, so excessive or under-performant queries can be reigned in.
- ASP.NET routing is a powerful, and sometimes maddening, feature. Glimpse cracks into the black box and exposes how routes are matched.
- Know everything necessary about a request's origin server including timezone, patch version, process ID, and pertinent web.config entries.
- Shows data for all requests including Ajax requests.
- Works for ASP.NET web-forms also
- Glimpse also gives details of ASP.NET routing.
- Automatically traces everything so you can easily trace logs and you can also integrate other popular logging frameworks with it.
6. MiniProfiler (Open Source)
MiniProfiler is a library and UI for profiling your application.
MiniProfiler supports both .NET Full Framework and .NET Core.
Features:
- Provides an ADO.NET profiler, capable of profiling calls on raw ADO.NET (SQL Server, Oracle, etc), LINQ-to-SQL, Entity Framework (including Code First and EF Core), and a range of other data access scenarios.
- See where your time is spent, which queries are run, and any other custom timings you want to add.
- MiniProfiler helps you debug issues and optimize performance.
7. Redgate Antprofiler
ANTS Performance Profiler is a .NET profiler for desktop, ASP.NET, and ASP.NET MVC applications.
Features:
- Profile your SQL queries and see execution plans.
- Profile database requests your application makes to any SQL Server, Oracle, MySQL (or MariaDB), and PostgreSQL database.
- Find performance bottlenecks fast by profiling both the .NET code and the data access layer
- Get rich performance data, right-down to line-level timings, and expensive database queries
- Save time going round in circles diagnosing and debugging – let the profiler do the hard work for you
- Explore unfamiliar codebases
- View rich data about outbound HTTP requests made by your application, including request and response header information.
8. dotTrace by Jetbrains
dotTrace helps you detect performance bottlenecks in a variety of .NET and .NET Core applications: WPF and Universal Windows Platform, ASP.NET, Windows services, WCF services, and unit tests. Mono and Unity applications are supported as well.
Features:
- Analyze any performance issues
- Profile SQL queries and HTTP requests
- Profile static methods and unit tests
- Profile and analyze results right in Visual Studio: With dotTrace you can profile, view performance timelines, analyze call stacks, and perform many more profiling actions without leaving your IDE.
- Works on Windows, macOS, and Linux
- Profile async calls
- Starts with $39.9/month
So, these were some of the best APM for .NET/.NET Core, if we have missed anything feel free to mention it in comments section.
You may also like to read:
Create SQL Server Database using SQL Server Management Studio
 Buy us a coffee
 Become a Patron