
How Can I enable Javascript debugging in Chrome using Visual Studio 2017 or 2019? I have been using Visual Studio 2017, but I am not able to debug Javascript code by placing debug in the Visual Studio Javascript code.
So, how can I achieve it and check line by line output of the Javascript code? I have checked this article ("How to debug in visual studio? ( Tutorial to debug C# code )") but it shows debugging C# code in Visual Studio.
 Answered by:- vikas_jk
You can enable debugging on Javascript using "debugger" keyword in your Javascript code and then use the Chrome browser "console" area to debug the code.
You will actually see the output of each line of code, when you will hit "F10" to debug each line of JS code.
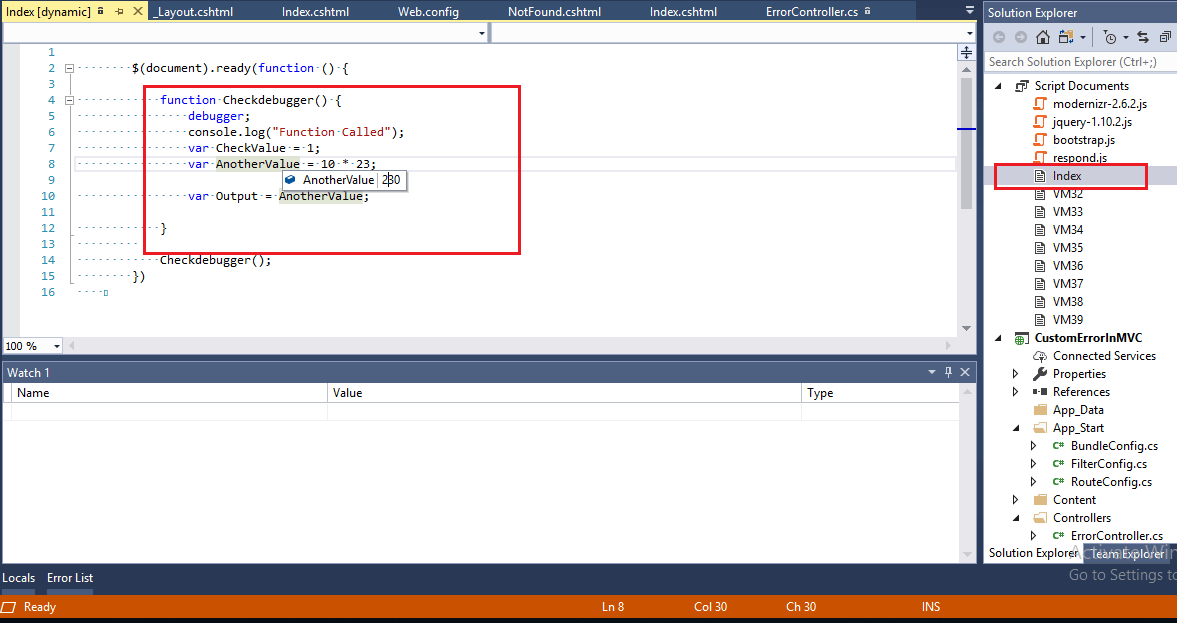
Suppose this is your Javascript code
            function Checkdebugger() {
                debugger;
                console.log("Function Called");
                var CheckValue = 1;
                var AnotherValue = 10 * 23;

                var Output = AnotherValue;

            }

            Checkdebugger();
Then you will see the output in chrome's console as below

As you can see in the above output, your Web-Browser's Console should be open to Debug JS code.
Once the debugger is hit, you can press "F10" to check output of each line of code.
Another method
Go to Tools -> Options -> Debugging -> General and turn on the setting Enable JavaScript Debugging for ASP.NET (Chrome, Edge and IE).
Then once you will hit "F5".
Using above option you can now debug both JavaScript and TypeScript directly in Visual Studio when using Google Chrome or Edge as a browser.
You can see the below sample output when debugging JS in Visual Studio
Answered by:- vikas_jk
If you are looking to launch javascript debugger in chrome, you can simply open console using shortcuts.
Windows and Linux:
Ctrl + Shift + I keys to open Developer Tools
Ctrl + Shift + J to open Developer Tools and bring focus to the Console.
Ctrl + Shift + C to toggle Inspect Element mode.
OR
You can also try adding below JS code
debugger;It will help you enable debugging in Javascript.
Subscribe to our weekly Newsletter & Keep getting latest article/questions in your inbox weekly
 Buy us a coffee
 Become a Patron