
In previous articles, we have provided step by step procedure for creating Google chart in .NET MVC and Chart in ASP.NET Web-Forms, now in this article, I am providing sample code to create .NET Core Charts using Google Charts by reading JSON data returned from Controller.
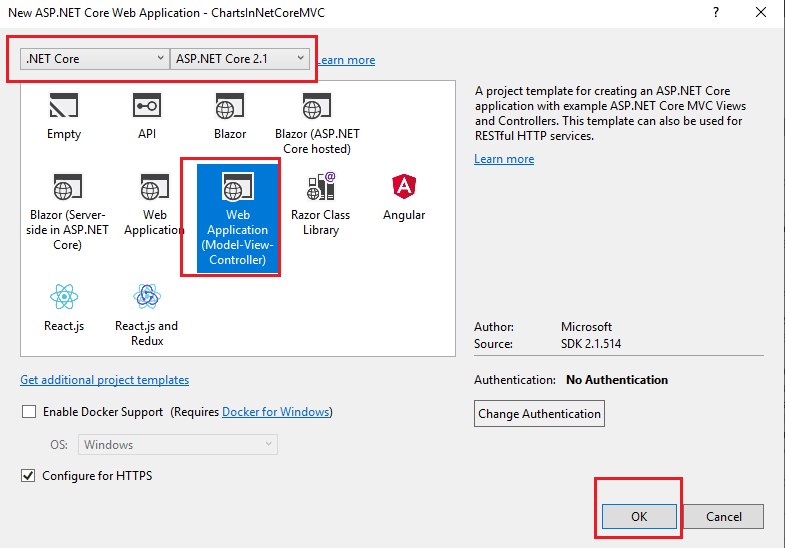
Step 1: Create a new ASP.NET Core project in your Visual Studio, by navigating to File -> New -> Project -> Select "ASP.NET Core Web-application" (from right-pane) and select .NET Core from left pane. (We are using .NET Core 2.1 version, but you can use same code for .NET 3 or .NET 5 also, for creating google chart in it)
Name your project and Click Ok.

In Next Screen, select "Web-Application (Model-View-Controller)" and Click OK, so Visual Studio can generate template based on .NET Core MVC.
Step 2: Now Create a new Class named as "BlogPieChart.cs", which can have below code
 public class BlogPieChart
    {
        public string CategoryName { get; set; }
        public int? PostCount { get; set; }
    }
Step 3: Navigate to HomeController.cs and then use the below code to return JSON data for pie chart
  public JsonResult GetPiechartJSON()
        {
            List<BlogPieChart> list = new List<BlogPieChart>();

            list.Add(new BlogPieChart { CategoryName = "Technology", PostCount = 11 });
            list.Add(new BlogPieChart { CategoryName = "Health", PostCount = 5 });
            list.Add(new BlogPieChart { CategoryName = "Windows", PostCount = 2 });

            return Json(new { JSONList = list });
        }
You can see we are simply creating a list of "BlogPieChart", adding list items and then returning them using Get method.
You can also note, there is no need to use "JsonRequestBehavior.AllowGet" in .NET Core unlike ASP.NET MVC.
Step 4: Now, we will navigate to "Views"-> "Home" -> "Index.cshtml" view, you will see pre-generated code, delete it.
Now, you can use below HTML and Javascript code to load Pie chart in the view
<div class="row">
<div class="col-lg-12">
<div id="chartdiv" style="width: 600px; height: 350px;">
</div>
</div>
</div>
@section Scripts{
<script type="text/javascript" src="https://www.gstatic.com/charts/loader.js"></script>
<script type="text/javascript">
google.charts.load('current', { 'packages': ['corechart'] });
//Call function after Google Chart is loaded, it is required, otherwise you may get error
google.charts.setOnLoadCallback(DrawonLoad);
function DrawonLoad() {
$(function () {
$.ajax({
type: 'GET',
url: '/Home/GetPiechartJSON',
success: function (chartsdata) {
// Callback that creates and populates a data table,
// instantiates the pie chart, passes in the data and
// draws it.
//get jsonList from Object
var Data = chartsdata.jsonList;
var data = new google.visualization.DataTable();
data.addColumn('string', 'CategoryName');
data.addColumn('number', 'PostCount');
//Loop through each list data
for (var i = 0; i < Data.length; i++) {
data.addRow([Data[i].categoryName, Data[i].postCount]);
}
// Instantiate and draw our chart, passing in some options
var chart = new google.visualization.PieChart(document.getElementById('chartdiv'));
//Draw pie chart command with data and chart options
chart.draw(data,
{
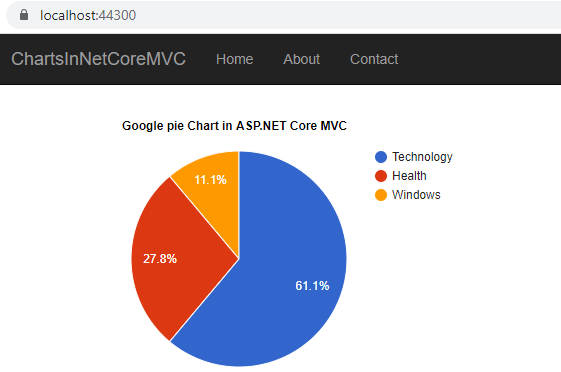
title: "Google pie Chart in ASP.NET Core MVC",
position: "top",
fontsize: "14px",
});
},
error: function () {
alert("Error loading data! Please try again.");
}
});
})
}
</script>
}
Once, you are done, you will see output like below
If you want to convert the above code into "3D" you can simply enable "Is3D" = true when drawing pie chart as shown in the below code
// Instantiate and draw our chart, passing in some options
                    var chart = new google.visualization.PieChart(document.getElementById('chartdiv'));

                    //Draw pie chart command with data and chart options
                    chart.draw(data,
                        {
                            title: "Google pie Chart in ASP.NET MVC",
                            position: "top",
                            fontsize: "14px",

                            is3D: true // this makes pie chart 3D

                        });
JS Code Explanation:
I have tried to explain the Javascript part of code line by line using comments.
Basically, we are adding Columns in Pie chart using below JS Code
var Data = chartsdata.jsonList; // check here jsonList is not same as "JSONList" of C# controller
var data = new google.visualization.DataTable(); //create datatable

data.addColumn('string', 'CategoryName'); //add columns
data.addColumn('number', 'PostCount');
Once we are done with adding columns, you can then loop through returning JSON data using JS for loop and add data in columns
  //Loop through each list data
                    for (var i = 0; i < Data.length; i++) {
                        data.addRow([Data[i].categoryName, Data[i].postCount]);
                    }
You can see in the BlogPost.cs we had "CategoryName" as column name, but when looping and fetching value it is changed to "categoryName", intial character is now lowercase, otherwise, we will not be able to read it's value.
That's it, in the end we will instantiate chart and draw it using below code
 // Instantiate and draw our chart, passing in some options
                    var chart = new google.visualization.PieChart(document.getElementById('chartdiv'));

                    //Draw pie chart command with data and chart options
                    chart.draw(data,
                        {
                            title: "Google pie Chart in ASP.NET Core MVC",
                            position: "top",
                            fontsize: "14px",
                        });
You may also like to read:
 Buy us a coffee
 Become a Patron