
In one of our previous article, we have provided list of useful javascript drag and drop libraries, now in this post, I am going to provide you list of various useful Javscript charting libraries or you can say free or paid javascript chart library, which can be useful to create Javascript based Charts in your web-applications.
1. Chart.js (Free)
Chart.js is really simple JS Chart library and Open source, you can easily configure it according to your needs.
You can download the latest version from GitHub or directly use it using CDN.
Chart.js uses HTML5 canvas tag and can be helpful to create line, bar, donut/pie etc various charts.
You can create responsive Charts using JSON data with it.
Example:
<canvas id="myChart" width="400" height="400"></canvas>
<script>
var ctx = document.getElementById('myChart');
var myChart = new Chart(ctx, {
    type: 'bar',
    data: {
        labels: ['Red', 'Blue', 'Yellow', 'Green', 'Purple', 'Orange'],
        datasets: [{
            label: '# of Votes',
            data: [12, 19, 3, 5, 2, 3],
            backgroundColor: [
                'rgba(255, 99, 132, 0.2)',
                'rgba(54, 162, 235, 0.2)',
                'rgba(255, 206, 86, 0.2)',
                'rgba(75, 192, 192, 0.2)',
                'rgba(153, 102, 255, 0.2)',
                'rgba(255, 159, 64, 0.2)'
            ],
            borderColor: [
                'rgba(255, 99, 132, 1)',
                'rgba(54, 162, 235, 1)',
                'rgba(255, 206, 86, 1)',
                'rgba(75, 192, 192, 1)',
                'rgba(153, 102, 255, 1)',
                'rgba(255, 159, 64, 1)'
            ],
            borderWidth: 1
        }]
    },
    options: {
        scales: {
            yAxes: [{
                ticks: {
                    beginAtZero: true
                }
            }]
        }
    }
});
</script>
2. FusionCharts (Paid)
Fusion charts is one of the most comprehensive charts, which contains more than 900 charts, and around 90 maps, but it is paid.
Charts created using Fusion charts are responsive charts, means it is compatible with Mobile and Desktop browsers.
You can render Fusion charts using JSON/XML data with HTML5 canvas, and it can be easily exported in PNG,JPG or PDF format.
3. Google Charts (Free)
Google Charts are most widely used charts and can be easily configured to use it in your web-application.
With Google Charts, you can render charts with HTML5 Canvas or SVG.
It is free to use and have high community support from around the worls, so if you are stuck with something while developing charts using this Javascript library, then you can easily get help from many forums and blogs.
Example to create Pie chart using Google Charts:
<html>
  <head>
    <script type="text/javascript" src="https://www.gstatic.com/charts/loader.js"></script>
    <script type="text/javascript">
      google.charts.load('current', {'packages':['corechart']});
      google.charts.setOnLoadCallback(drawChart);

      function drawChart() {

        var data = google.visualization.arrayToDataTable([
          ['Task', 'Hours per Day'],
          ['Work',     11],
          ['Eat',      2],
          ['Commute',  2],
          ['Watch TV', 2],
          ['Sleep',    7]
        ]);

        var options = {
          title: 'My Daily Activities'
        };

        var chart = new google.visualization.PieChart(document.getElementById('piechart'));

        chart.draw(data, options);
      }
    </script>
  </head>
  <body>
    <div id="piechart" style="width: 900px; height: 500px;"></div>
  </body>
</html>
Fiddle sample:
You may like to read: Google Charts in ASP.NET MVC , Pie chart in ASP.NET Web-Forms
4. D3.js (Free)

D3.js is another widely used Javascript charts library, which is free to use and have excellent support.
It allows you to bring data to life using HTML, SVG, and CSS.
D3’s emphasis on web standards gives you the full capabilities of modern browsers without tying yourself to a proprietary framework, combining powerful visualization components and a data-driven approach to DOM manipulation.
One of the excellent feature of D3 is, it allows you to bind arbitrary data to a Document Object Model (DOM), and then apply data-driven transformations to the document.
For example, you can use D3 to generate an HTML table from an array of numbers. Or, use the same data to create an interactive SVG bar chart with smooth transitions and interaction.
Example:
// chart data
	var chartConfig = {
		barWidth:20,
		data:[{
					"sale": "202",
					"year": "2000"
				}, {
					"sale": "215",
					"year": "2001"
				}, {
					"sale": "179",
					"year": "2002"
				}, {
					"sale": "199",
					"year": "2003"
				}, {
					"sale": "134",
					"year": "2004"
				}, {
					"sale": "176",
					"year": "2010"
				}]
	};

	// enviornment setup
		var svgConfig = {
						id:"mySvg",
						width:600,
						height:300,
						margin : {
							top: 20,
							right: 20,
							bottom: 20,
							left: 50
						  }
						};

	// drawing
		// append svg element
			var bodySelection = d3.select("body");

			var svgSelection  = bodySelection.append("svg")
								.attr("id", svgConfig.id)
								.attr("width",svgConfig.width)
								.attr("height",svgConfig.height);

		// create x scale
			xScale = d3.scale.linear().range([svgConfig.margin.left, svgConfig.width - svgConfig.margin.right]).domain([d3.min(chartConfig.data, function(d) {return +d.year;})-1,d3.max(chartConfig.data, function(d) {return +d.year;})]);

		// create y scale
			yScale = d3.scale.linear()
					   .range([svgConfig.height - svgConfig.margin.top, svgConfig.margin.bottom])
					   .domain([134,d3.max(chartConfig.data, function(d) {return +d.sale;})]);

		// create bars
			svgSelection.selectAll("rect")
						   .data(chartConfig.data)
						   .enter()
						   .append("rect")
						   .attr("x", function(d) {
								return xScale(+d.year) - chartConfig.barWidth/2;
						   })
						   .attr("y", function(d) {
								return yScale(d.sale) - svgConfig.margin.bottom;
						   })
						   .attr("width", chartConfig.barWidth)
						   .attr("height", function(d) {
								return svgConfig.height - yScale(d.sale);
						   })
						   .attr("fill", function(d) {
								return "rgb(90, 0, " + (+d.sale) + ")";
						   })

		//let's create the axes using the scales
			xAxis = d3.svg.axis()
					.scale(xScale)
					.tickFormat(d3.format("d"));

			yAxis = d3.svg.axis()
					.orient("left")
					.scale(yScale);

		// add xaxis to chart - it will add it to top of the svg
			svgSelection.append("svg:g")
			.attr("id","xAxis")
			.attr("class","axis")
			.call(xAxis);

		// The X axis is drawn but it has some issues. First, we need to position it vertically downwards using transform property
			d3.select("#xAxis")
			.attr("transform", "translate(0," + (svgConfig.height - svgConfig.margin.bottom) + ")");

		// add yaxis to chart, but this will not add it to correct oorientation
			svgSelection.append("svg:g")
			.attr("id","yAxis")
			.attr("class","axis")
			.call(yAxis);

		// apply transform logic to bring it to correct place
			d3.select("#yAxis")
			.attr("transform", "translate(" + (svgConfig.margin.left) + ",0)")
5. Chartist.js (Free)
Chartist.JS is free to use and responsive Javascript chart library and it has only 10KB in size, which doesn't need any exeternal JS library to be incldued, to use it.
Features of Chartist.JS
- Easy to use
- Great flexibility while using clear separation of concerns (Style with CSS & control with JS)
- Usage of SVG
- Fully responsive and DPI independent
- Responsive configuration with media queries
- Fully built and customizable with Sass
Sample code
var data = {
  labels: ['Jan', 'Feb', 'Mar', 'Apr', 'Mai', 'Jun', 'Jul', 'Aug', 'Sep', 'Oct', 'Nov', 'Dec'],
    series: [
    [500, 419, 398, 450, 469, 520, 580, 510, 610, 680, 700, 728]
  ]
};

var options = {
  seriesBarDistance: 100
};

new Chartist.Line('.ct-chart', data, options);
Sample fiddle:
6. Morris.JS (Free)
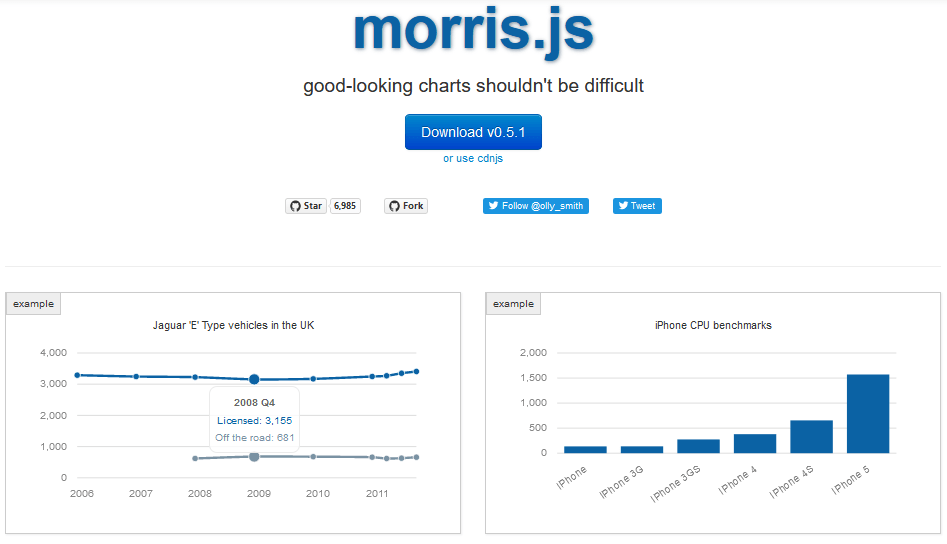
Morris.JS library is easy to use and integrate with any web-application.
It is a lightweight library based on jQuery and Raphael, that provides simple, clean line, area charts, bar, and donut charts.
It is free to use.
7. C3.js (Free)
C3.js is a free javascript chart library based on D3.js
As D3.Js is difficult to learn at beginning, C3.js makes it easier for you to creating charts quickly and easily.
Here is the simple code to create Bar chart using C3.js
var chart = c3.generate({
    data: {
        columns: [
            ['data1', 30, 200, 100, 400, 150, 250],
            ['data2', 130, 100, 140, 200, 150, 50]
        ],
        type: 'bar'
    },
    bar: {
        width: {
            ratio: 0.5 // this makes bar width 50% of length between ticks
        }
        // or
        //width: 100 // this makes bar width 100px
    }
});
Features that make C3 library useful are its ease of use, the customization options, and the control you have over the rendered charts.
Fiddle Example:
8. Frappe Charts (Free)
Frappe charts are GitHub-inspired simple and modern SVG charts for the web with zero dependencies.
One of the best feature of this chart is that you can also export chart, by just adding a simple export button using this library, one liner code 'chart.export();'
The library comes with many built-in chart types, like bar, line, area, pie, and donut charts.
There are many more charts library, which you can try other than above mentioned like
- AnyChart (Paid)
- AmCharts (Paid)
- Billboard.js (open-source)
- NVD3 (Open-Source)
That's it.
You may also like to read:
Javascript Unit Testing Frameworks
Read CSV file in Javascript and HTML5 FileReader (Multiple ways)
 Buy us a coffee
 Become a Patron